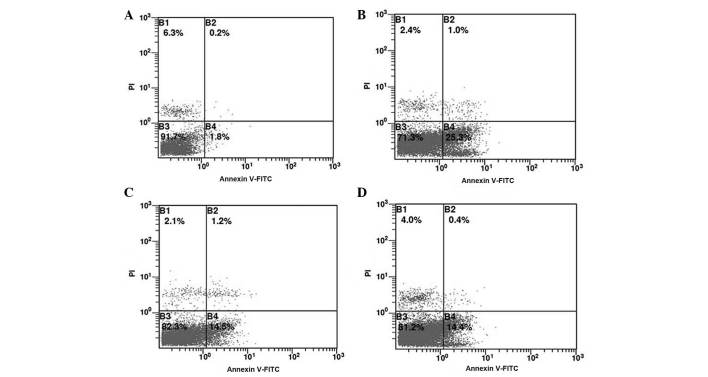
Figure 7.
SAN inhibits H9c2 cardiac cell apoptosis induced by Ang II. Flow cytometry dot plots showing necrotic cells (Annexin V−/PI+) in the upper left, late apoptotic cells (Annexin V+/PI+) in the upper right, early apoptotic cells (Annexin V+/PI−) in the lower right and viable cells (Annexin V−/PI−) in the lower left. (A) Control group, the percentage of early apoptotic cells was 1.8%; (B) Stimulated by Ang II (10 µM) only, the percentage of early apoptotic cells was 25.3%; (C) Stimulated by Ang II (10 µM) and SAN (0.5 µM), the percentage of early apoptotic cells dropped to 14.5%; (D) Stimulated by Ang II (10µM) and NAC (1 mM), the percentage of early apoptotic cells dropped to 14.4%. Values are expressed as the mean ± standard error of the mean for three independent experiments. SAN, sanguinarine; Ang, angiotensin; NAC, N-acetylcysteine; FITC, fluorescein isothiocyanate; PI, propidium iodide.

