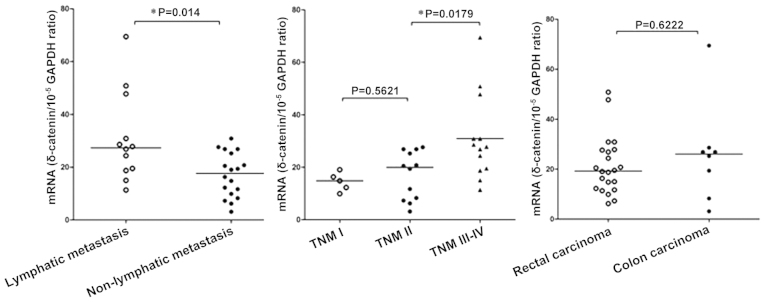
Figure 4.

Correlation between δ-catenin mRNA expression and the clinicopathological features of 30 colorectal cancer patients. The horizontal solid lines indicate the median value in each group. *P-values were calculated using the non-parametric Mann-Whitney test or Kruskal-Wallis test. TNM, tumor, nodes, metastasis stage.
