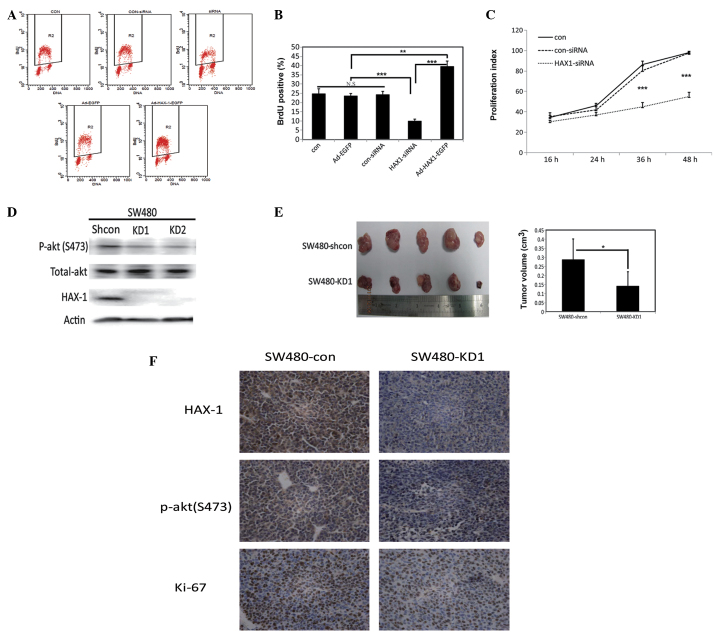
Figure 3.
Effects of the expression of HAX-1 on proliferation. (A) Representative dot-plot distributions of BrdU assay using flow cytometry in the SW480 human colorectal cancer cells transfected with Ad-EGFP, Ad-HAX-1-EGFP, con-siRNA or HAX-1-siRNA for 48 h. (Con, SW480 cells without infection; Ad-EGFP, SW480 cells infected with empty vector; Ad-HAX-1-EGFP, SW480 cells infected with Ad-HAX-1-EGFP vector; con-siRNA, SW480 cells transfected with control siRNA; siRNA, SW480 cells transfected with HAX-1-siRNA). The R2, gate represents the percentage of BrdU positive cells. (B) Quantification of Brdu positive cells. Experiments were repeated at least three times. Values represent the mean ± standard deviation (**P<0.01; ***P<0.001). (C) Proliferation index curve of SW480 cells transfected with con-siRNA and HAX-1-siRNA for 48 h. The proliferation index was calculated based on fluorescence intensity, detected using a CFSE assay. (Con, SW480 cells without transfection; con-siRNA, SW480 cells transfected with scramble siRNA; HAX-1-siRNA, SW480 cells transfected with HAX-1-siRNA). (D) Western blot analysis of the expression levels of p-akt (S473), total-akt and HAX-1 in SW480 cells transfected with shRNA-con (Shcon), shRNA1 (KD1) or shRNA2 (KD2) vectors for 48 h. (E) Left panel shows xenografts of BALB/c mice (n=5) transplanted with 5×10⁵ HAX-1-knockdown SW480 cells (SW480-KD1), compared with the control (SW480-shcon). The right panel shows quantification of tumor volumes Values are presented as the mean ± standard deviation (*P<0.05). (F) Representative immunohistochemical images of HAX-1, p-akt (S473) and Ki-67 in the mice xenografts. HAX-1, hematopoietic cell-specific protein 1-associated protein X-1; shRNA, short hairpin RNA; siRNA, small interfering RNA; BrdU, bromodeoxyuridine; siRNA, small interfering RNA; shRNA, short hairpin; N.S, not significant.

