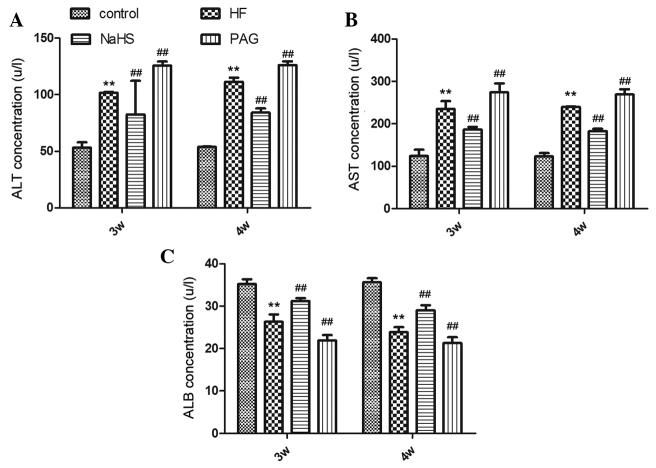
Figure 1.
Serum expression levels of (A) alanine transaminase, (B) aspartate transaminase, and (C) albumin for each group. The error bars indicated the mean ± standard deviation (**P<0.01 vs. normal control group, ##P<0.01 vs. the model group). NaHS, sodium hydrosulfide; PAG, DL-propargylglycine; HF, hepatic fibrosis.

