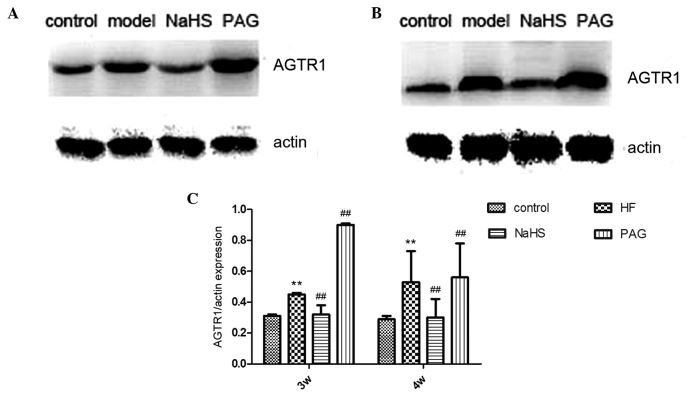
Figure 8.
Protein expresssion levels of angiotensin II type 1 receptors (AGTR1) as determined by western blot analysis in the rat groups at (A) week three and (B) week four. Actin was used as an endogenous control. Actin was used as an endogenous control. (C) Quantification of AGTR1 expression levels. The error bars indicated the mean ± standard deviation (**P<0.01 vs. normal control group, ##P<0.01 vs. the model group). NaHS, sodium hydrosulfide; PAG, DL-propargylglycine.

