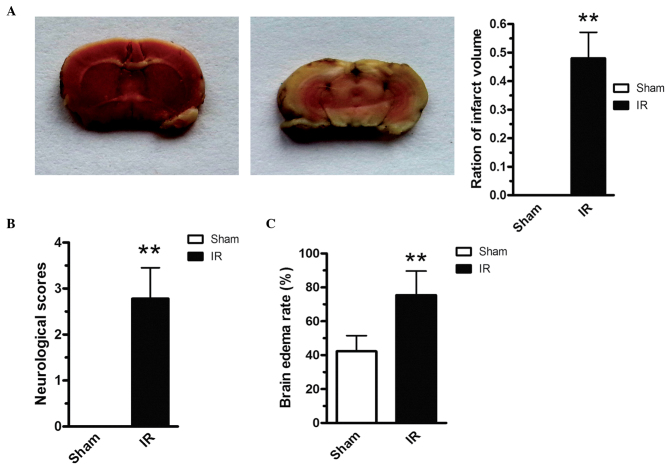
Figure 1.
Evaluation of the cerebral infarction post-reperfusion model in rats. (A) Cerebral infarct, (B) neurological deficit scores and (C) brain edema were determined. The quantitative data (n=6 animals per group) are presented as the mean ± standard deviation. **P<0.01 vs. sham group. IR, ischemia reperfusion.

