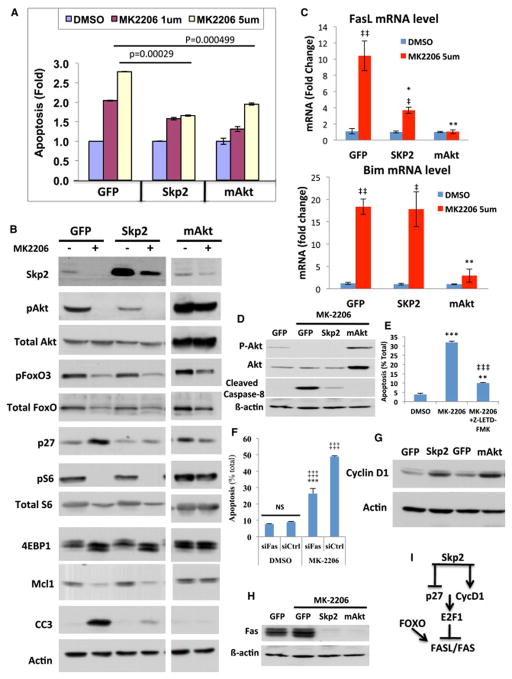
Figure 7. Ectopic expression of Skp2 or mAkt in p53−/− thymic lymphoma cells exerts resistance to MK2206.
A. Induction of cell death of control GFP expressing cells, Skp2 or mAkt expressing cells after treatment with MK2206 for 18h. Data are presented as an average of three independent experiments ± SEM. B. Immunoblot showing the phosphorylation of Skp2 expression, FOXO3 phosphorylation, p27 expression, mTORC1 activity as measured by S6 phosphorylation and 4EBP1 mobility shift, Mcl-1 and cleaved caspase 3 (CC3) expression in GFP, Skp2 or mAkt expressing cells following treatment with MK2206 for 18h. C. Expression of FasL and Bim as measured by RT-PCR in GFP, Skp2 or mAkt expressing cells following treatment with MK2206 for 18 hours. Data are presented as an average of three independent RNA preparations ± SEM. **p<0.01 *p<0.05 vs. GFP; ‡‡ p<0.01 ‡p<0.05 vs. DMSO in each group. D. Immunoblot showing the level of cleaved caspase 8 in GFP, Skp2 or mAkt expressing cells following treatment with 1μM MK2206 for 18h.E. Induction of cell death of p53−/− thymic lymphoma cells after treatment with 1μM MK2206 for 18h in presence or absence of cell permeable caspase-8 inhibitor (Z-LETD-FMK). Data are presented as an average of 3 independent experiments in triplicates ± SEM. *** p<0.0001 and ** p<0.005 compared to DMSO. ‡‡‡ p<0.0001 compared to MK2206. F. Cells were treated with DMSO or MK2206 for 18h after knockdown of Fas using a pool of 4 siRNAs. Following treatment, cell death was assessed by flow (PI staining). Experiments were done twice in triplicate. Statistical analysis: ***p<0.0001 compared to control siRNA. ‡‡‡ p<0.0001 compared to DMSO. G. Immunoblot showing Cyclin D1 expression in GFP, Skp2, or mAkt expressing cells. H. Fas expression in GFP, Skp2 or mAkt expressing cells. I. Illustration depicting the mechanism by which Akt inhibition promotes cells death in p53−/− thymic lymphoma.

