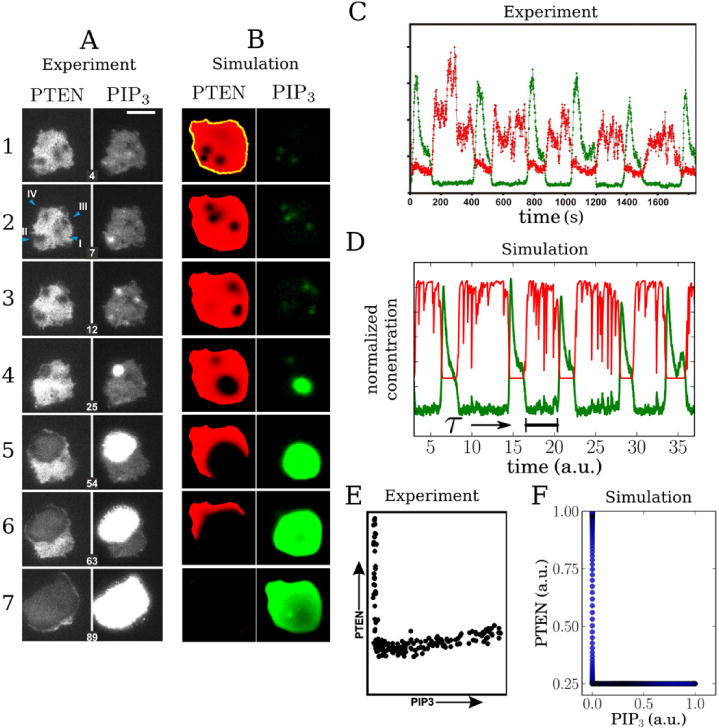
Figure 1.

Comparison of experimental results obtained by Gerisch et al [35] (A, C, and E) and captured by our simulations (B, D, and F). (A) Polarization in Dictyostelium discoideum cells labeled with PTEN and PIP3 fluorescent markers and measured using TIRF microscopy. An incomplete polarization cycle is shown (without PTEN reentry). The first three panels from top to bottom for each marker exhibit transient hole formations of PTEN with transient clustering of PIP3. The 4th row shows the nucleation of a PIP3 wave inside a PTEN hole. The remaining panels show the propagation of the PIP3 and PTEN wave. Time (in min) is indicated by the number in each panel set. (B) Simulated polarization cycle of PIP3 (green) and PTEN (red) following the model presented in this paper and using the parameter values of supplementary table 1. The cell morphology is indicated by the yellow dashed line and was taken from an experiment. (C) Local time traces of the normalized PTEN (red) and PIP3 (green) concentration as observed in the experiments [35]. These traces were computed by averaging a 3×3 pixel array at an arbitrary position on the membrane. (D) Corresponding local time traces as determined in our simulations with PTEN in red and PIP3 in green. The quantity τ represents the average minimum time delay between the return of PIP3 to basal levels and a novel excitation. (E) Experimental trajectory of the fluorescence intensity in the PIP3/PTEN phase plane obtained at the location of a hole. (F) Corresponding phase trajectory obtained in our simulation.
