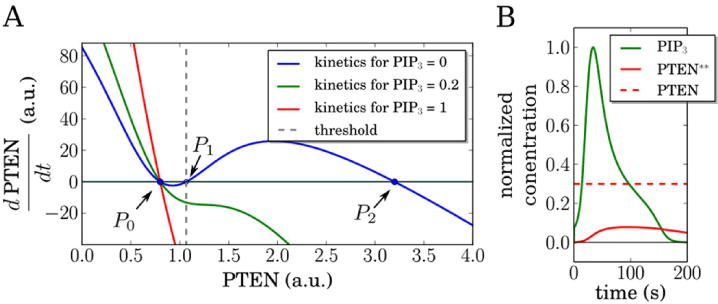
Figure 3.

Dynamics of the proposed model. (A) Local kinetics (neglecting diffusion and noise) of PTEN for different constant PIP3 values. If the PIP3 concentration is low (blue curve), PTEN will show bistability corresponding two stable fixed points (P0 = 0.8 and P2 = 3.2) and an unstable one (P1 = 1.1). For higher values of PIP3 only the lower stable fixed point P0 remains. Remaining parameter values as in supplementary table 1. (B) Local normalized concentration profiles (neglecting diffusion and noise) of PIP3 and PTEN** for constant concentration of PTEN. PTEN* can be calculated from PTEN* = PTEN − PTEN**. Parameter values in (A) and (B) are given in supplementary table 1. PIP3 is normalized to its maximum value while PTEN and PTEN* are normalized by P0.
