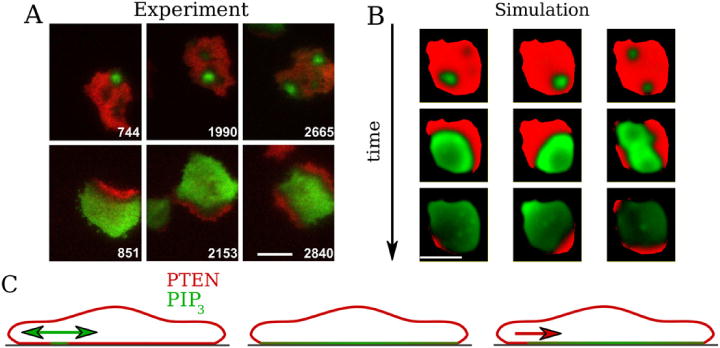
Figure 4.

(A) Merged fluorescent images of PIP3 (green) and PTEN (red) measured by Gerisch et al [35], illustrating the coordinated reentry of PTEN. The upper panels show the PIP3 nucleation spots and the corresponding lower panels represent the PTEN reentry sides at a later time. PTEN always reenters from the location on the cell perimeter which is closest to the PIP3 nucleation spot. Time is seconds and scale bar represents 10 μm. (B) Snapshots of PTEN reentry (PIP3 (green) and PTEN (red)) according to our simulations (bar 10 μm). (C) Schematic sketch of PTEN/PIP3 distributions on the membrane postulated in our model and based on experimental results. It illustrates (from left to right) hole formation, PIP3 wave propagation and coordinated reentry of PTEN. The membrane not attached to the surface continuously exhibits high levels of PTEN even when the surface-attached PTEN membrane level is low and, thus, acts as a reservoir for membrane-bound PTEN.
