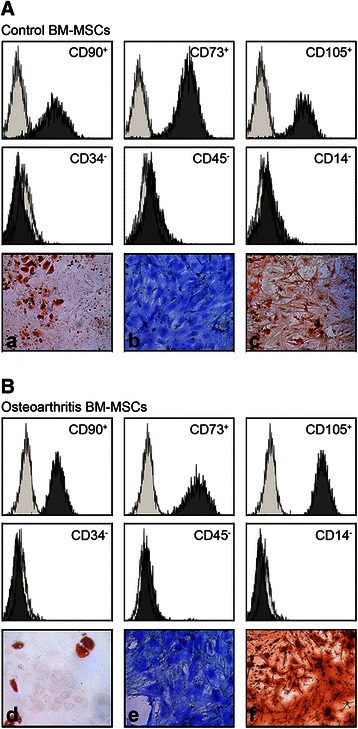
Fig. 1.

Characterization of BM-MSCs by Flow Citometry and in vitro potential of differentiation. Representative flow Cytometry analysis of bone marrow MSCs obtained from one Control (non-OA) donor (a). and one osteoarthritic patient (b). MSCs at third passage were positive for MSC specific markers (CD90, CD73, CD105 and negative for CD34, CD45 and CD14). Figure represents an overlay image of antibody isotype controls (light gray histogram) and specific marker antibodies (dark gray histogram). Histochemical staining of In vitro potential of differentiation through the adipogenic, chondrogenic and osteogenic lineages measured at day 21 (adipogenesis and osteogenesis) or 28 (chondrogenesis) for Control BM-MSCs (a, b and c respectively) and OA BM-MSCs (d, e and f). Magnification × 100
