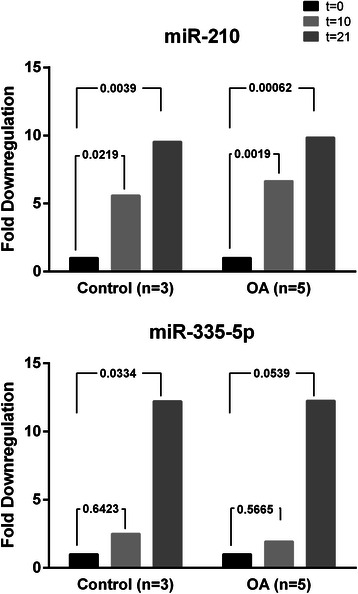
Fig. 2.

Relative Quantification of comparisons between t = 10 and t = 0; t = 21 and t = 0 of significant miRNAs in OA-MSCs and Control-MSCs. Expression of miR210 and miR-335-5p follow a similar downregulation trend during osteogenic differentiation of MSCs, both in OA (n = 5) or in Control subjects (n = 3). Project was normalised using: hsa-miR-103a-3p; hsa-miR-191-5p; hsa-miR-30c-5p; SNORD49A. Test Type used: Parametric test (Limma). FDR method: Benjamini-Hochberg Adjusted p-value threshold: 0.05
