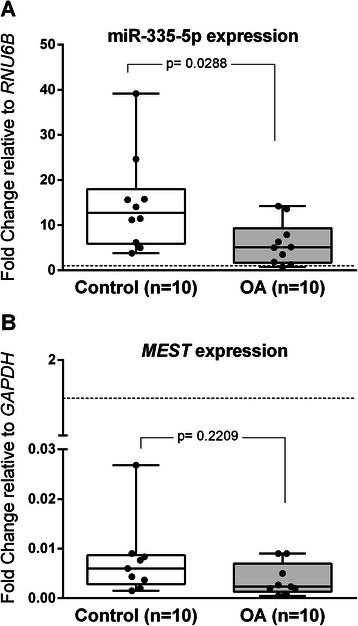
Fig. 3.

miR-335-5p and MEST expression in OA-MSCs and Control-MSCs. a. Box and wiskers plot of miR-335-5p expression in OA-MSCs and Control-MSCs relative to the RNU6B internal control gene. b. MEST expression in human in OA-MSCs and Control-MSCs relative to the GAPDH reference gene. A positive correlation between miR-335-5p and MEST expression was detected (Spearman correlation coefficient, r = 0.59; p = 0.0961 in OA and r = 0.6; p = 0.0968 in controls
