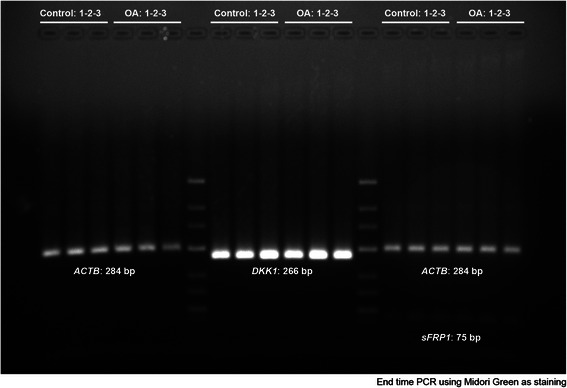
Fig. 4.

Two percent agarose gel of DKK1 and SFRP amplification products from OA-MSCs and Control-MSCs. After synthesizing the first strand cDNA, it was amplified using PCR. The PCR product was analyzed by agarose gel electrophoresis. PCR reactions (25ul) were loaded as follow: Lanes [1–6] ACTB [8–13] DKK1. [15–20] ACTB + SFRP1. Lanes 7 and 14 correspond to the molecular markers (GeneRuler™ Low Range DNA Ladder, Fermentas). This result shows that single specific PCR product was obtained with expected molecular amplicon sizes. No differences were found in band intensity between OA-MSCs and Control-MSCs
