
Fig. 6.
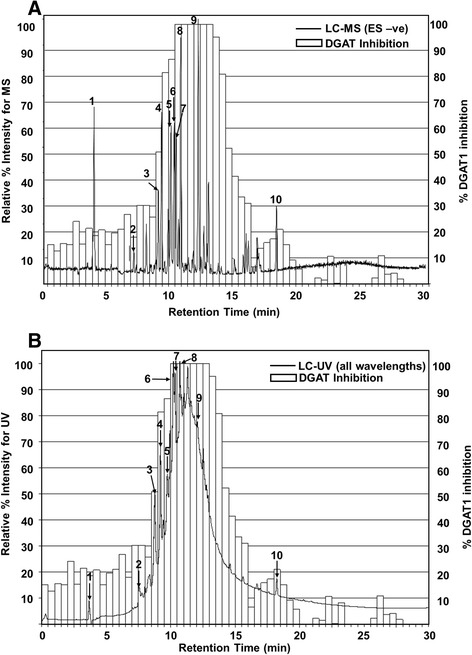
Cell-free DGAT1 inhibition from chromatographic fractionation of GE with overlay of the corresponding LC-MS and LC-UV chromatograms. a The LC-MS chromatogram was generated using base peak index utility to differentiate major compounds. b The LC-UV chromatogram represents the sum of all wavelengths to better show the complex mixture and abundance of phytochemicals in the GE extract. DGAT1 enzyme inhibition (right side x-axis) correlates with the LC-UV pattern and abundance (left side x-axis), showing that multiple phytochemicals in the GE extract are responsible for the observed inhibition. Identities of numbered peaks are given in Table 5