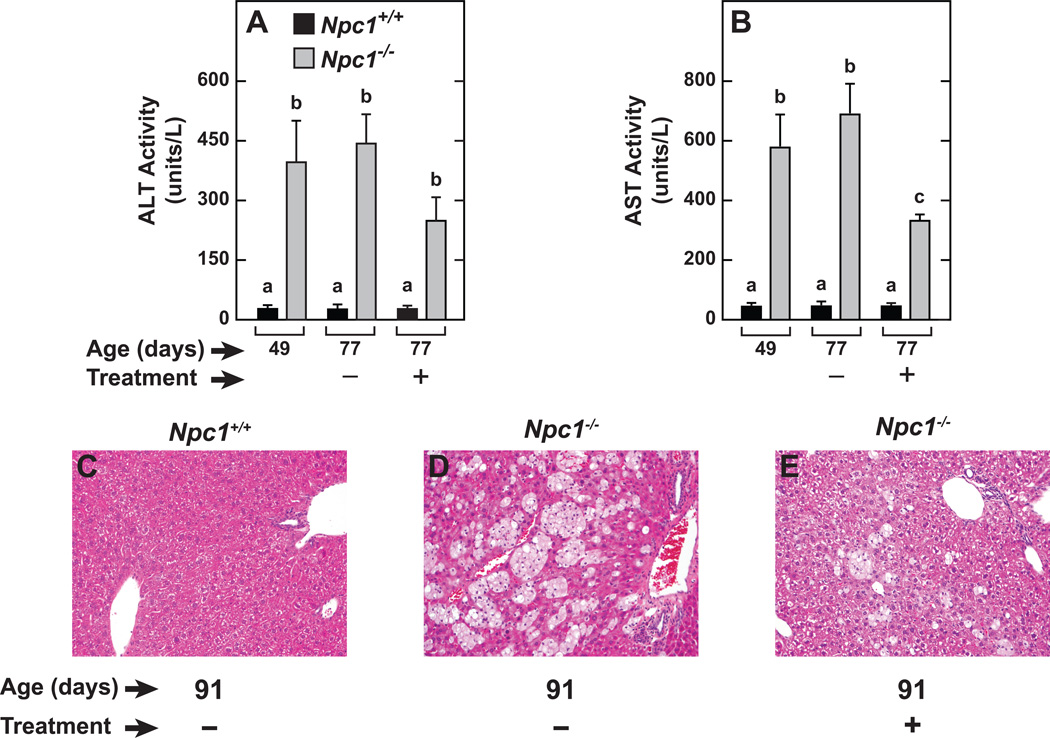
Fig. 4.
Plasma transaminase activities and representative liver histology in Npc1+/+ and Npc1−/− mice given either saline or 2HPBCD at weekly intervals starting at 49 days of age. In one experiment, plasma ALT (A) and AST (B) activities were determined in 77-day old Npc1+/+ and Npc1−/− mice that had received either saline (−) or 2HPBCD (+) injections at 49, 56, 63 and 70 days of age. Liver histology, by hematoxylin and eosin staining, (C, D and E) was carried out in a smaller number of 91-day old mice that had received treatment at 49, 56, 63 70, 77, and 84 days of age. In all panels photos are at the same magnification (×200). The values for plasma ALT and AST activity are the mean±1 SEM of data from 4 to 7 animals in each group. Different letters (a–c) denote statistically significant differences between values (P<0.05) as determined by two-way ANOVA, with genotype, age and treatment as variables.

