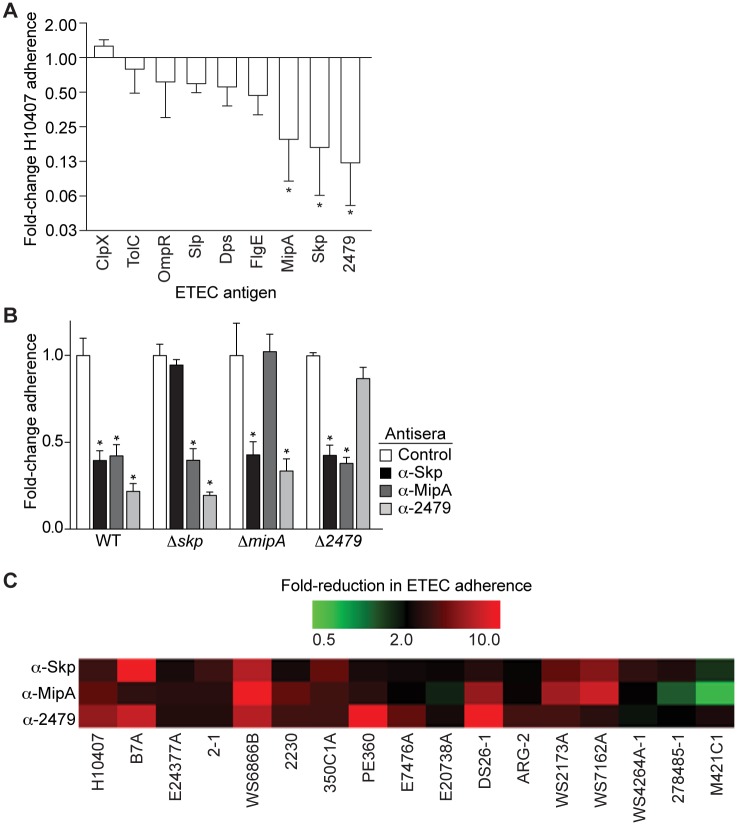
Fig 2. Adherence assays.
A. Adherence of ETEC H10407 to HCT-8 cells in the presence of antisera. The fold-change in ETEC H10407 adherence is plotted as a function of incubation with the indicated antisera, after normalization to control samples. Asterisks indicate the antisera showing significant protection against ETEC H10407 that were selected for further characterization, n = 3/group. B. Analysis of antisera specificity. Deletion mutants were constructed for the skp, mipA, and ETEC_2479 genes and then analyzed for their adherence to HCT-8 cells in the presence of the indicated antisera. Asterisks indicate significant reduction in bacterial adherence, n = 4-12/group. C. Heat map displaying the fold-change in adherence of the indicated ETEC strains to HCT-8 cells after their incubation with the indicated antisera. The scale ranges from 0.5 to a 10-fold decrease in adherence, as compared with control samples, n = 3/group. Red colors depict reduced ETEC adherence in the presence of antisera, while green colors depict increased adherence. The midpoint of the color gradient was set as a 2-fold reduction in adherence (black).

