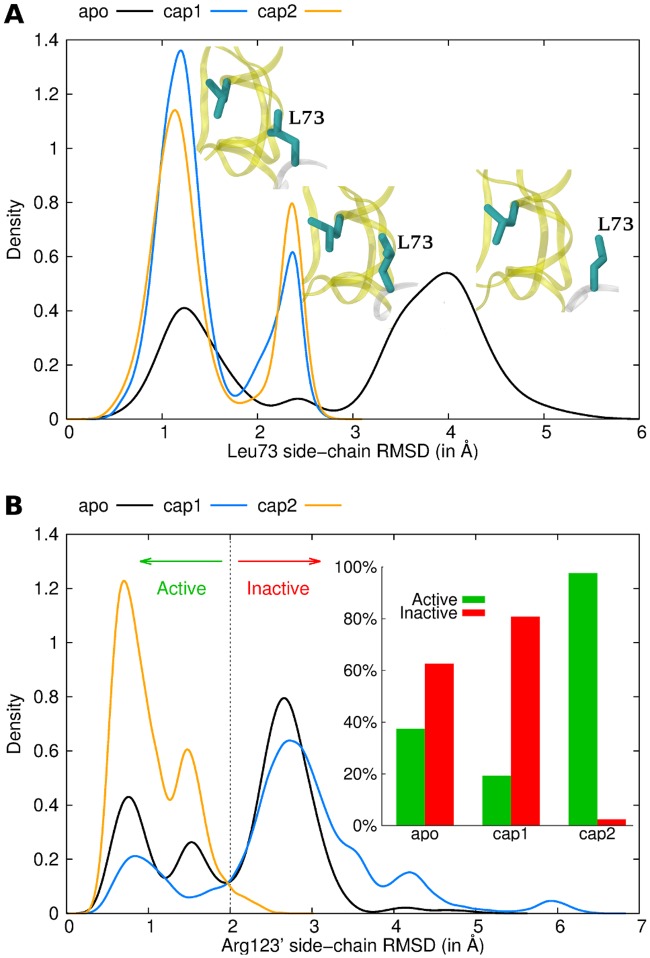
Fig 4. Conformational ensemble of Leu73 (A) and Arg123’ (B), involved in pathway A, for the apo (black), the cap1 (blue) and the cap2 (orange) states.
The protein is represented as cartoon in white (first protomer) and yellow (second protomer). Key residues are represented as cyan sticks. Histograms of local RMSDs are shown. The average structure of all CAP simulations was used as reference structure for the fitting and RMSD calculation, allowing to directly compare conformations of different states. Only residues around a 6Å cut-off were used for the fitting to track local rearrangements without including global motions.

