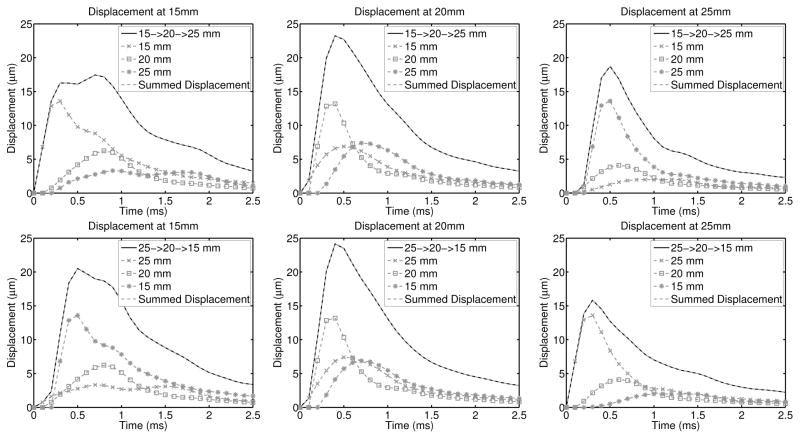
Fig. 1.
Simulated displacement though time profiles (without simulated ultrasonic tracking) are shown for each focal configuration and at each focal depth, with the appropriate time delays applied according to when the pushes started in the multi-focal zone configurations. The top row of images compares the profiles when pushing at the shallowest focal depth first and the bottom row of images utilized the deep-to-shallow configuration. In each plot, the dashed gray line indicates the time-delayed and summed output of the three individual focal zone simulations and is nearly identical to the solid black line, which is the multi-focal zone simulation. As expected for a linear system, the RMS difference between the time-delayed and summed displacement profiles and the multi-focal zone simulations is less than 0.01μm in all configurations.

