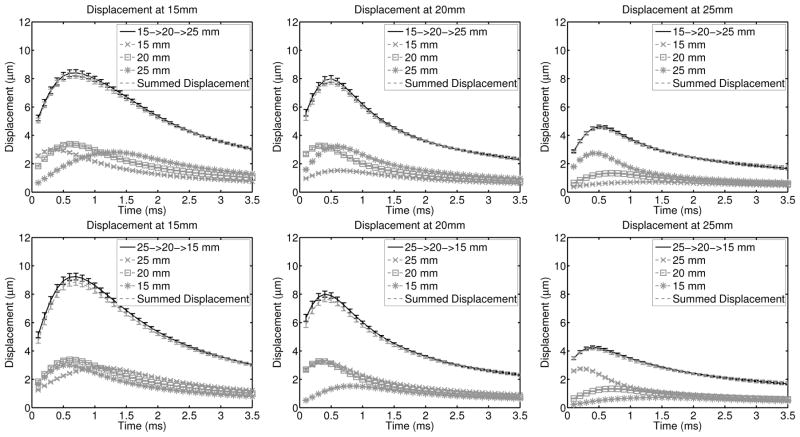
Fig. 2.
Experimentally acquired displacement though time profiles in a uniform region of the phantom are shown for each focal configuration and at each focal depth in the same configuration as figure 1. The error bars indicate the standard deviation over 9 independent speckle realizations. In each plot, the solid black line (the multi-focal zone data) is in agreement with the dashed gray line (the sum of the individual focal zone acquisitions). The RMS difference through time between the time-delayed and summed displacement profiles and the multi-focal zone acquisitions is less than 0.2μm in all configurations, which is consistent with the simulations results in figure 1.

