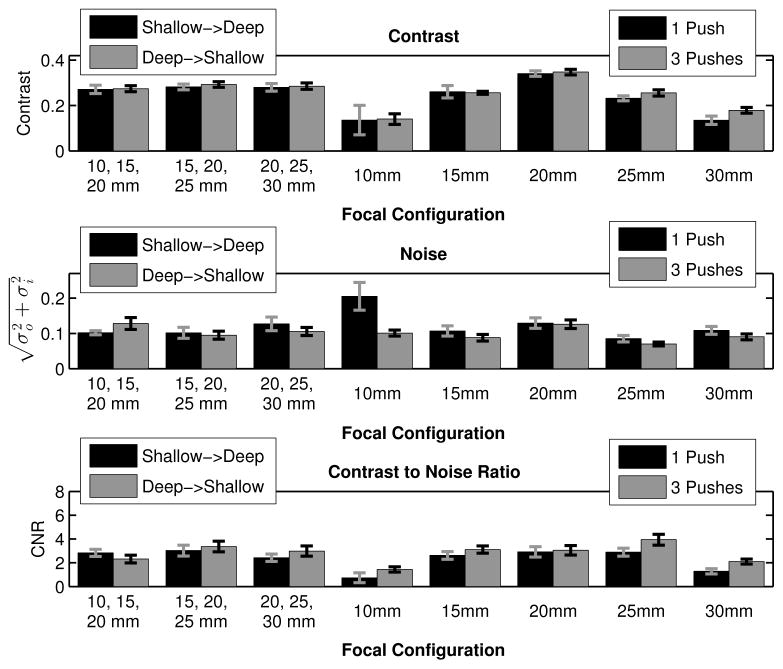
Fig. 7.
Contrast, noise, and CNR of the 4 mm cylindrical target are given, where the error bars indicate the standard deviation over 9 independent speckle realizations. The bar plots portray the data from the time step where the maximum contrast through time was observed. As expected per the derivation in III, the 20 mm push focal configuration yields the highest contrast (paired Student’s two-tailed t-test, p < 0.01).

