
Figure 3.
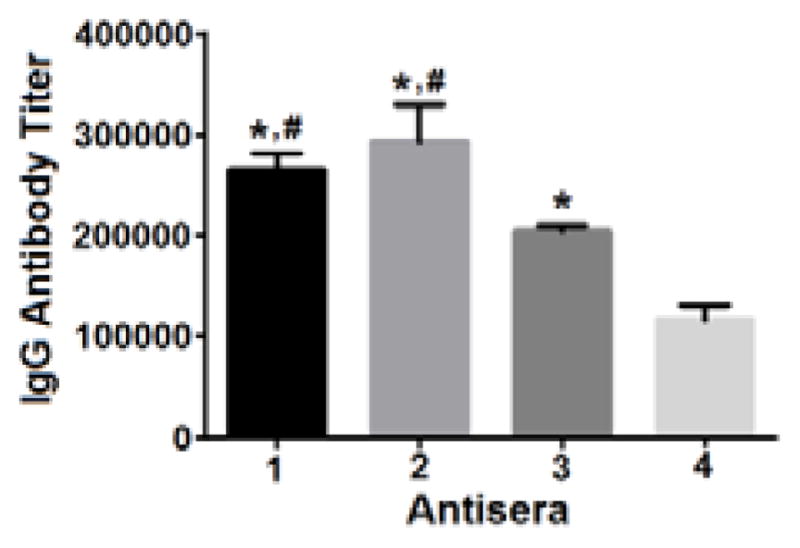
The average titers of antigen-specific total IgG antibodies in the day 38 antisera of individual mice inoculated with 1, 2, 3, and 4. Error bar shows the standard error of mean for each group of mice. The difference is statistically significant (P < 0.05) as compared to 4 (*) or 3 (#).