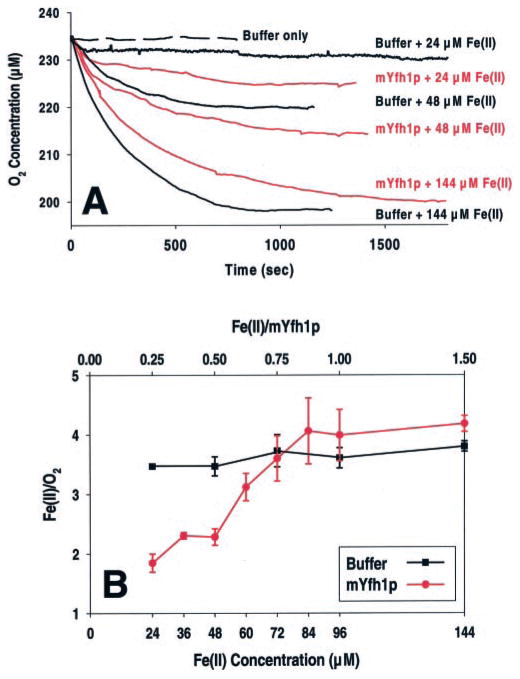
Fig. 1. Ferroxidase activity of mYfh1p.
A, O2 consumption curves in the presence of 96 μM mYfh1p or buffer without protein added. The conditions were 10 mM HEPES-KOH, pH 7.0, at 30 °C in the presence of 24, 48, or 144 μM Fe(II). B, O2 consumption curves were recorded in the presence of 96 μM mYfh1p and the indicated Fe(II) concentrations. The Fe(II)/O2 stoichiometry determined for each completed reaction is plotted versus the Fe(II) concentration (bottom x axis) and the Fe(II)/mYfh1p subunit ratio (top x axis). The bars represent the means ± S.D. in 2–5 (mYfh1p; red plot) or 1–11 (buffer only; black plot) independent measurements. The pH remained between 7.00 and 6.97 throughout the reactions both in the absence and the presence of mYfh1p.

