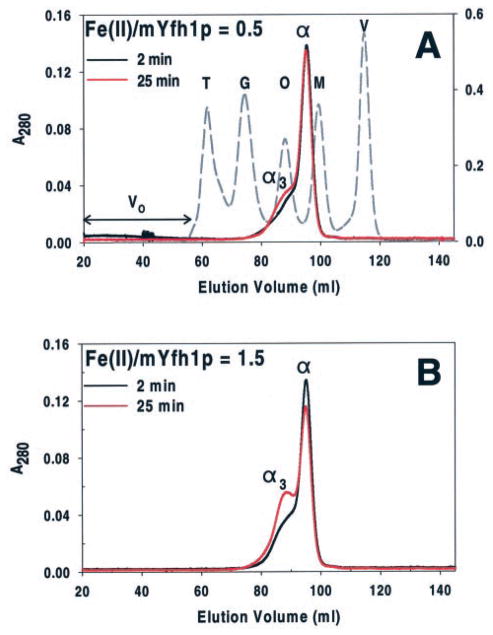
Fig. 2. Oligomerization of mYfh1p at low Fe(II)/mYfh1p ratios.
Two sets of reactions containing 96 μM mYfh1p and 48 (A) or 144 (B) μM Fe(II) were incubated at 30 °C for 2 min (black chromatogram) or 25 min (red chromatogram) and immediately analyzed by Superdex 200 gel filtration. Peaks α and α3 denote mYfh1p monomer and trimer, respectively. Fractions corresponding to the peaks of interest were analyzed for iron concentration by inductively coupled plasma emission spectroscopy. The protein concentration in fractions corresponding to peak α3 was estimated from the decrease in peak α from 2 to 25 min (ΔA280 = A280 (2 min) − A280 (25 min)). The elution profiles for mYfh1p are superimposed on that of molecular mass standards (dashed chromatogram). V, vitamin B12 (1.4 kDa); M, myoglobin (17 kDa); O, ovalbumin (44 kDa); G, gammaglobulin (158 kDa); T, thyroglobulin (669 kDa). The A280 of mYfh1p and molecular mass standards is shown on the left- and right-hand y axes, respectively. V0 denotes void volume as determined by the elution volume of blue dextran (2 MDa). As reported previously, mYfh1p monomer is eluted from gel filtration columns and migrates on SDS/PAGE (see Fig. 3C) with an apparent molecular weight of ~20,000 (23, 24), higher than the actual molecular weight of ~14,000 (23). A subunit molecular weight of 20,000 was used to estimate the number of subunits present in the ~50-kDa peak (α3) (23). Previous gel filtration analysis of mYfh1p assembly showed that coalescence of α3 into higher order intermediates to yield multimer requires concentrations of Fe(II) that exceed the iron-loading capacity of α3 (23), which is higher than the iron/subunit ratio used in Fig. 2B. This explains why no further assembly occurred under these conditions.

