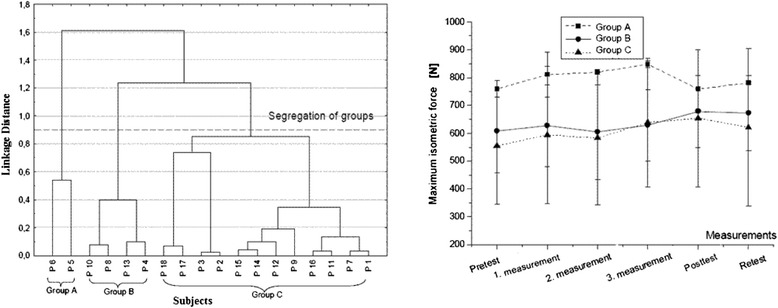
Fig. 6.

Left: tree diagram of Ward’s cluster analysis. Representation of groups of subjects (groups A, B, C) with similar maximum isometric force development from pre-retest of VG—group segregation after cluster analysis. Abscissa lists the subjects; ordinate shows the 1-Pearson correlation coefficient value (r) [31]. Segregation line was set at linkage distance 0.95. Right: presentation of mean maximum isometric force development of the three groups
