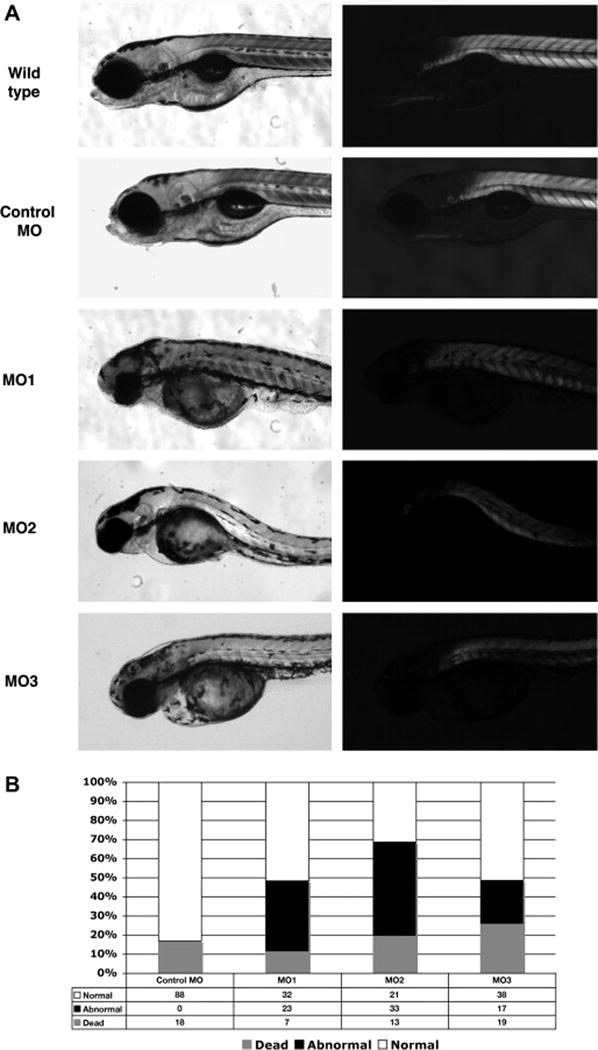
Figure 2.

Dysferlin morphants at 4 dpf
A, Dysferlin morphant at 4 dpf (Wild type fish, control MO injected fish, dysferlin MO1, MO2 and MO3 injected fish). Left, bright field images. Right, birefringence assay. B, Histogram of the percentage of normal, dead and affected fish in MO1, 2 or 3-injected fish. White bar shows the percentage which appeared normal. Black indicates the percentage of fish with abnormal development and gray indicated the percentage of fish which were dead.
