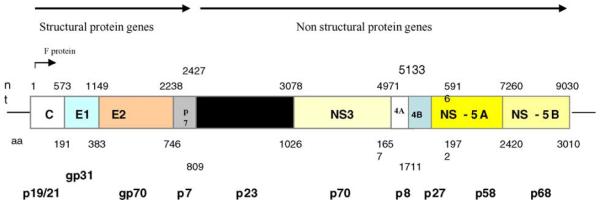
Fig. 1.

Organisation of the HCV genome. The figures immediately above the boxes depicting the HCV genes represent nucleotide positions at the 3′ end of each gene and the figures below the boxes depicts the amino acid position of a typical genotype 1 virus. The figures on the bottom line depict the electrophoretic mobility of each protein as determined by SDS-PAGE analysis. Not to scale.
