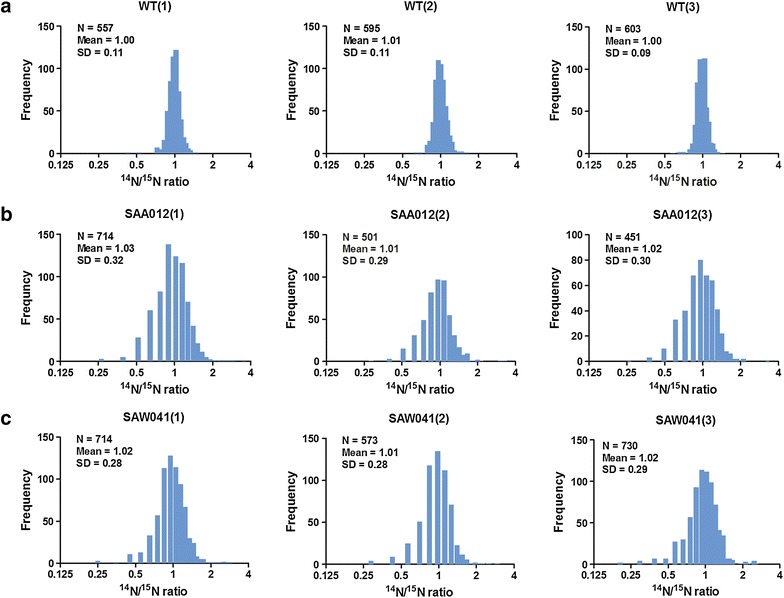
Fig. 2.

Normal distribution of normalized 14N/15N isotope ratios of quantified proteins in three biological replicates of the wild-type (WT) strain (a), the ethanol-producing mutant, SAA012 (b), and the lactate-producing mutant, SAW041* (c). The abscissa represents the number of quantified proteins (expressed as frequency), while the ordinate indicates the protein 14N/15N isotopic ratio (l/h). The number of quantified proteins, the mean value of the protein ratios, and the standard deviation of the protein ratios are indicated in the insets. (*Three proteins with a ratio >8-fold change were excluded).
