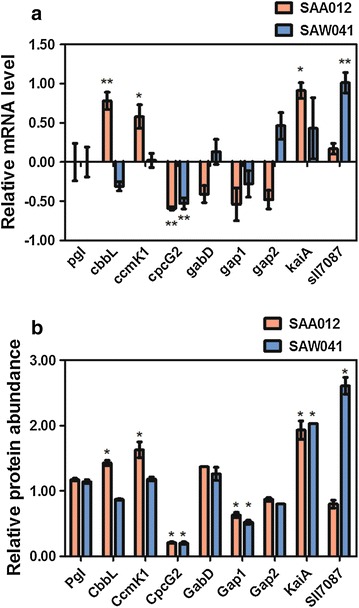
Fig. 6.

Altered mRNA- and protein expression level of selected genes of the two product-forming mutants, SAA012 and SAW041, relative to the WT strain. a Relative fold change of mRNA and protein level of the selected genes. Data are mean ± SEM of 3 biological- and 3 technical-replicates. Genes that were changed significantly in their level of expression are indicated with an asterisk. b Changes in relative protein abundance of the selected set of genes. Proteins with significantly changed expression level are marked with an asterisk (α < 0.01). Data are mean ± SEM of at least two biological replicates. Proteins that are shown without error bars, i.e. GabD in SAA012 and KaiA in SAW041, were quantified in only one biological replicate.
