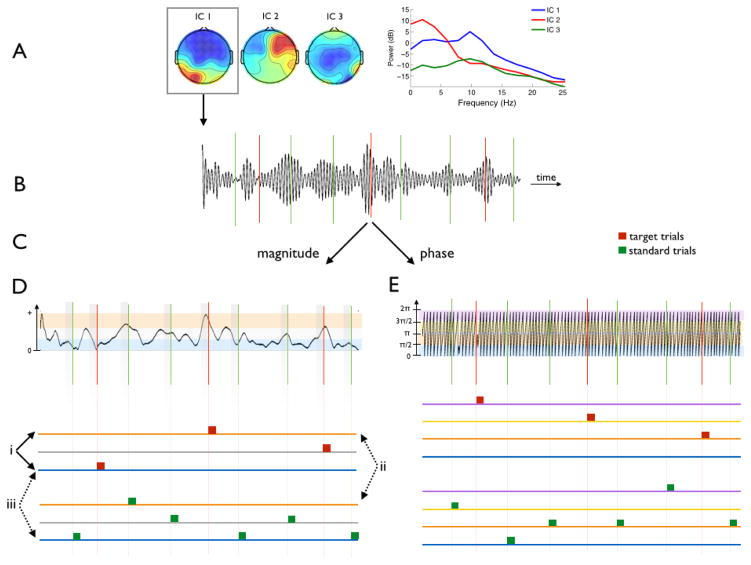
Figure 1. Construction of fMRI Model Based on EEG Alpha Activity.
EEG was collected in the fMRI scanner while subjects performed an auditory oddball task. Following preprocessing, ICA was applied to the continuous EEG. A. One “alpha component” was selected for all further analyses based on its power spectrum and scalp topography. B. The alpha component was bandpass filtered to extract the ongoing alpha activity. C. The Hilbert transform decomposed the signal into its magnitude and phase. D. Power Analysis BOLD Model: Trials were binned within stimulus class (targets represented in red, standards in green) into 3 groups based on high (orange), medium (grey), or low (blue) prestimulus alpha power. These groups were modeled separately so 3 contrasts (labeled i–iii) could be computed. Contrast i explored the effect of prestimulus alpha power on the target response. A paired t-test between contrasts ii and iii explored the effect of prestimulus alpha power on decision-related processing. E. Phase Analysis BOLD Model: Trials were binned into 4 groups according to instantaneous phase of the alpha oscillation at stimulus onset: 0 to (blue), to π (orange), π to (yellow), and to 2π (purple). Similar contrasts were performed here and are described within the text. Real data is shown, but ITI was shortened here relative to the alpha oscillation for illustration purposes.

