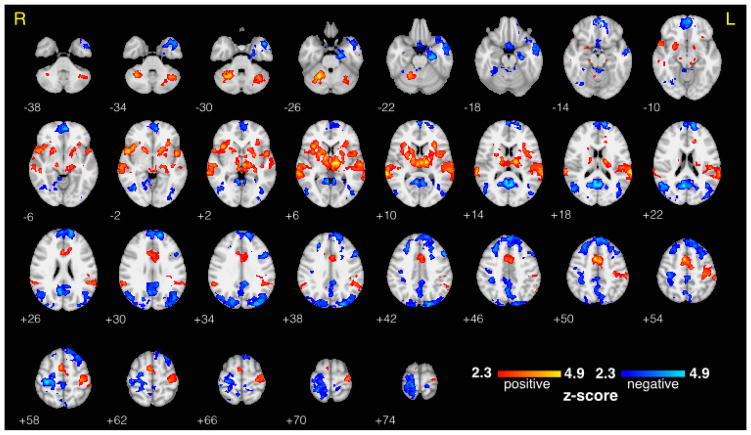
Figure 2. Traditional fMRI Results - Average BOLD Response to Target Trials.
Group level average fMRI BOLD response to auditory target stimuli (including all trials regardless of alpha activity), thresholded at z > 2.3 and cluster corrected at p < 0.05. Statistical maps are displayed on an MNI template brain using radiological coordinates, and z-coordinate is displayed to the lower left of each axial slice.

