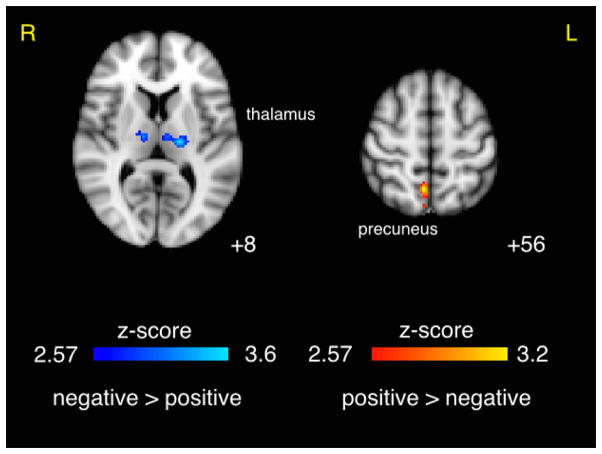
Figure 6. Effect of Prestimulus Alpha Phase on BOLD Response to Auditory Targets.
Contrasts showing BOLD response to target stimuli for negative vs. positive (trough vs. peak) and positive vs. negative (peak vs. trough) alpha phase at stimulus onset. Results shown were per-voxel thresholded at p < 0.005 then cluster-thresholded at p < 0.05 and are displayed in radiological orientation on an MNI template brain. z coordinates are specified.

