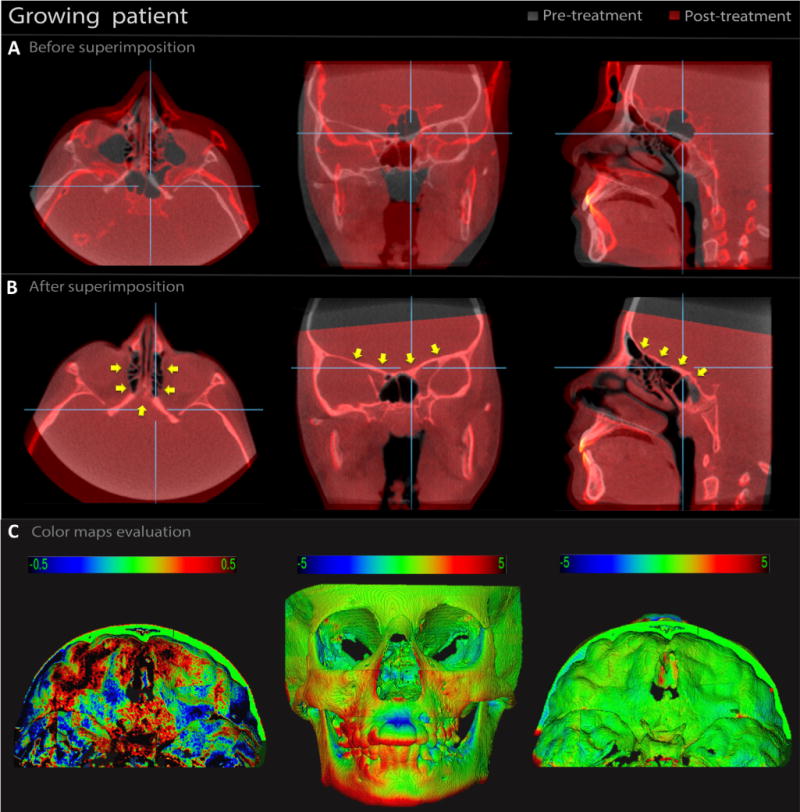
Fig. 4.

CBCT superimposition of a growing patient subjected to rapid palatal expansion (RPE) with 1-year follow-up. (A) Multiplanar slices of pre-treatment CBCT (grey) and post-treatment CBCT (red) before superimposition and (B) after superimposition, in OnDemand3D. Note the complete correspondence of registration at the anterior cranial base (yellow arrows). (C) 3D models after superimposition showing 3D displacements via colour maps. In the 0.5-mm colour map, the black areas represent changes of 0.5 mm, blue/red areas represent changes less than 0.5 mm, and green areas represent no changes. In the 5-mm colour map, the areas in black, red, and blue are due to the RPE and normal growth. The changes at the cranial base were minimal (green) (CMF application software). (For interpretation of the references to colour in figure legend, the reader is referred to the web version of the article.)
