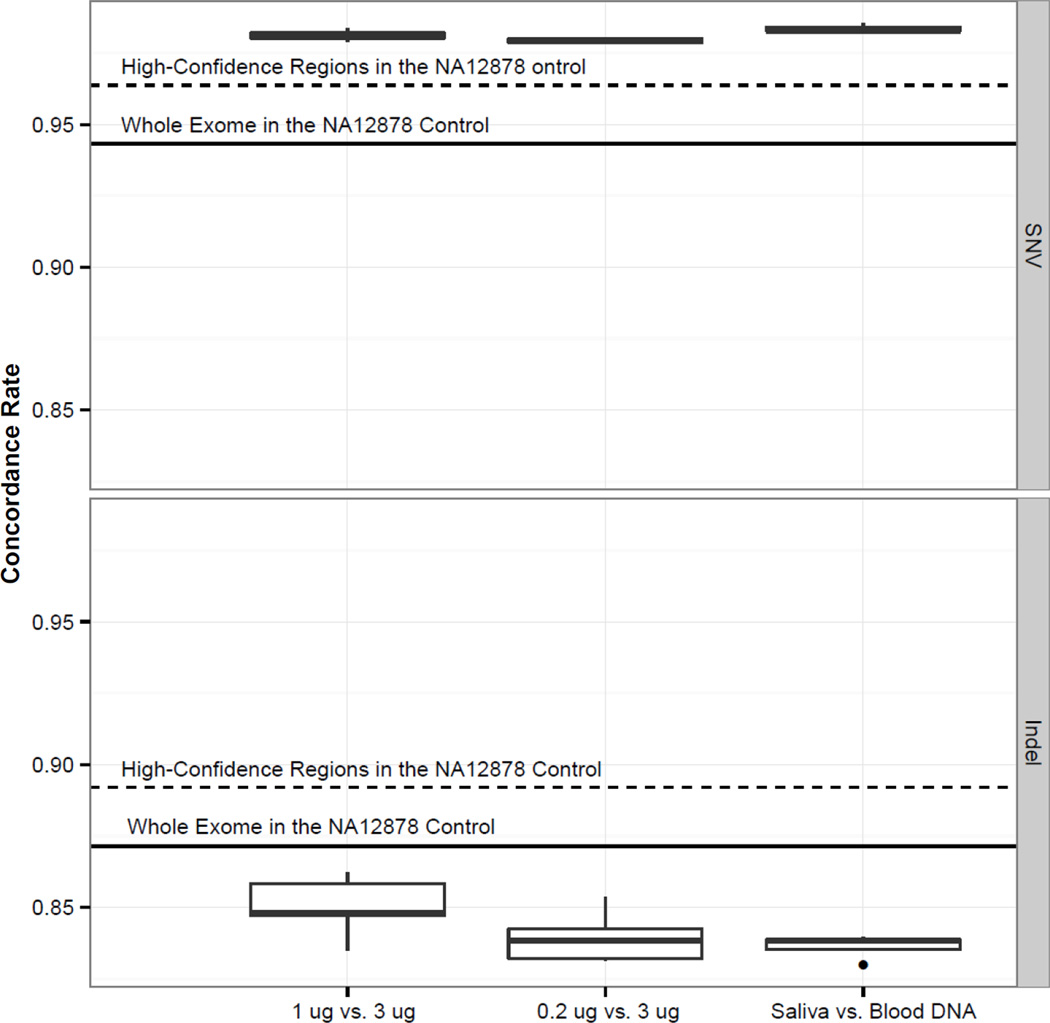
Figure 1.
Concordance of single nucleotide variant (SNV) calls (upper panel) and short insertion/deletion (indel) calls (lower panel). Boxplots of concordance rates between each pair of samples from the same patient are displayed: 1 µg vs. 3 µg DNA; 0.2 µg vs. 3 µg DNA; and 1 µg saliva DNA vs. 1 µg blood DNA. The top and bottom of the box correspond to the 3rd and 1st quartiles, respectively, and the band inside the box corresponds to the median. The ends of the whiskers represent the most extreme data points within 1.5 times the interquartile range from the box, and the dots indicate outliers that are beyond 1.5 times the interquartile range from the box.

