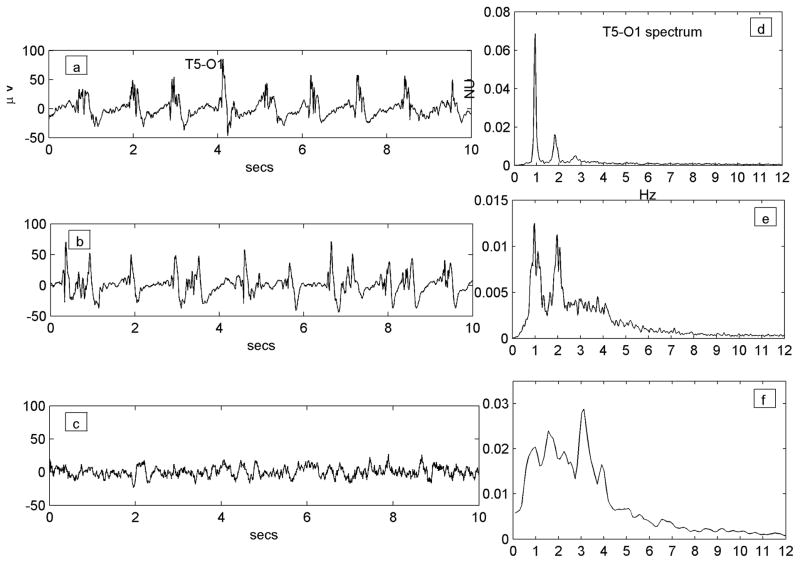
Figure 4.
Resolution of the PLED waveform over time in a patient who received continuous monitoring (Patient #19, with an old left hemispheric structural lesion and status epilepticus). Traces a), b) and c) are all of the same T5-O1 channel (channel label marked only once for clarity); figures d), e) and f) are the corresponding power spectra. a) A robust regular PLED waveform, whose spectrum d) shows a clear 2-peaked structure of a fundamental (at ~0.9 Hz) and its second harmonic (at ~1.8 Hz) along with a small third harmonic (~2.7 Hz). b) The waveform later in the illness becomes somewhat irregular with some reduction of sharp components. The spectrum at this stage e) has broadened out and lost the third harmonic, though a clear two-peak structure remains. c) In the immediate post-recovery phase the EEG has returned to near baseline with continuous polymorphic slowing only; its spectrum f) is wide-band, but exists largely in the same domain (~0–4 Hz) that gave rise to the PLED peaks earlier. There is peak at ~3.1 Hz not present in the PLED waveforms that represents faster frequencies that were filtered out in the formation of the PLED; the remainder of the spectrum (< 3 Hz) does possess a small local maximum at ~0.9 Hz that condenses and accrues harmonics to yield the PLED.

