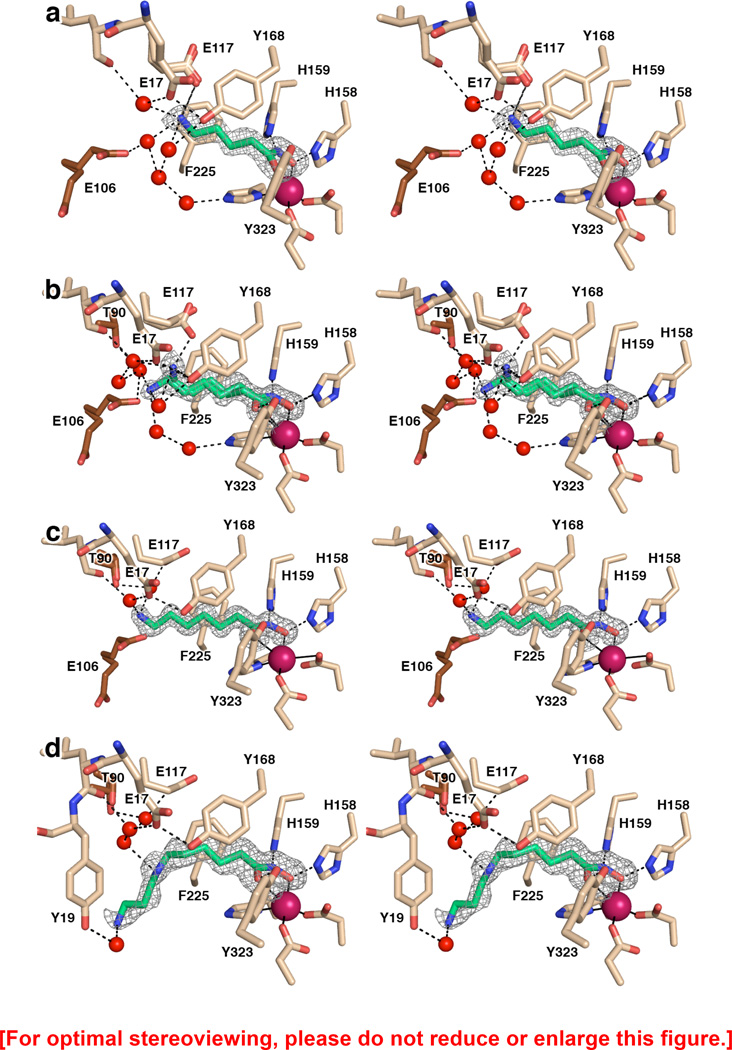
Figure 3.
(a) Simulated annealing omit map of hydroxamate 4 bound in the active site of APAH (monomer A, contoured at 3.5σ). Atomic color codes are as follows: C = wheat (protein, monomer A), brown (monomer B), or green (inhibitor), N = blue, O = red, Zn2+ = magenta. Water molecules are represented as red spheres. Metal coordination and selected hydrogen bond interactions are shown as solid black or dashed black lines, respectively. (b) Simulated annealing omit map of hydroxamate 5 bound in two conformations in the active site of APAH (monomer B, contoured at 3.0σ). Atomic color codes are identical to those in (a). (c) Simulated annealing omit map of hydroxamate 6 bound in the active site of APAH (monomer A, contoured at 4.0σ). Atomic color codes are identical to those in (a). (d) Simulated annealing omit map of hydroxamate 3 bound in the active site of APAH (monomer B, contoured at 3.0σ). Atomic color codes are identical to those in (a).

