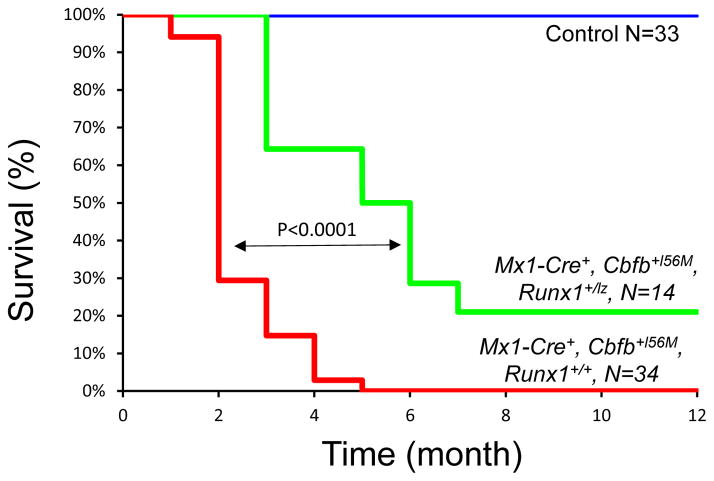
Figure 4. Impaired Runx1 activity delays leukemogenesis by Cbfb-MYH11.
Kaplan-Meier curve of mice with different genotypes during 12-month observation of leukemia development. Green line: Mx1-Cre+, Cbfb+l56M, Runx1+/lz, N=14; red line: Mx1-Cre+, Cbfb+l56M, Runx1+/l+, N=34; blue line: control mice (Runx1+/+, Runx1+/lz, and Cbfb+l56M), N=33. The p values were calculated with log rank test. The difference between any two survival curves in the panel was highly significant (p<0.0001).

