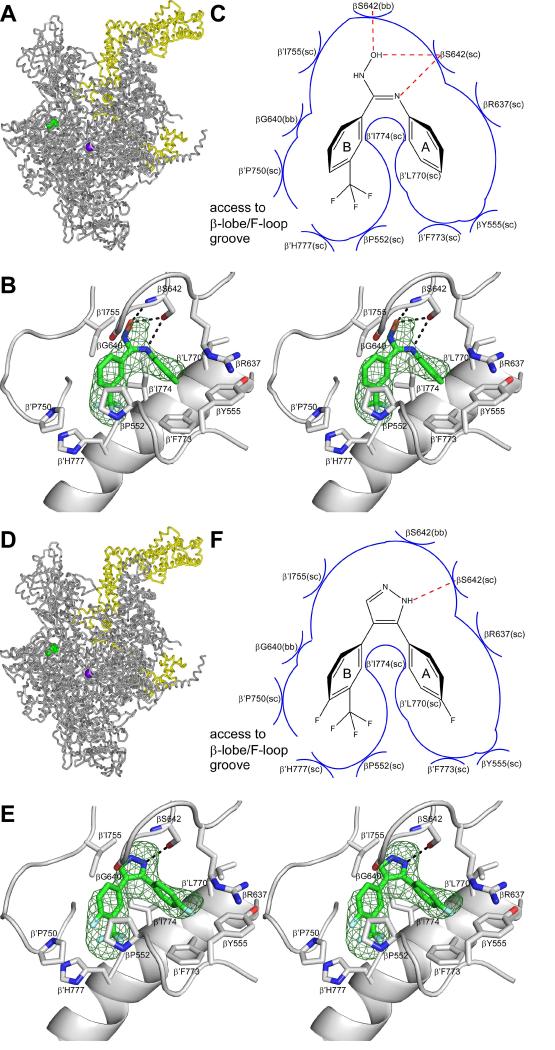
Figure 2. Crystal structures of E. coli RNAP holoenzyme in complex with CBR inhibitors.
Upper panels (A-C), data for the CBR hydroxamidine CBR703.
Lower panels (D-F), data for the CBR pyrazole CBRP18.
(A),(D) Structure of E. coli RNAP holoenzyme in complex with the CBR inhibitor. Gray ribbon: RNAP core. Yellow ribbon: σ70. Violet sphere: active-center catalytic Mg2+. Green: CBR inhibitor.
(B),(E) Contacts between RNAP and the CBR inhibitor(stereodiagram). Green mesh: NCS-averaged mFo-DFc electron density omit map for the CBR inhibitor (contoured at 2.5σ). Green, red, blue, and cyan: carbon, oxygen, nitrogen, and fluorine atoms of the CBR inhibitor. Gray ribbons: RNAP. Gray helical ribbon: RNAP bridge helix (N-terminus at right).
(C),(F) Schematic summary of inferred contacts between RNAP and the CBR inhibitor. Red dashed lines: H-bonds. Blue arcs: van der Waals interactions.

