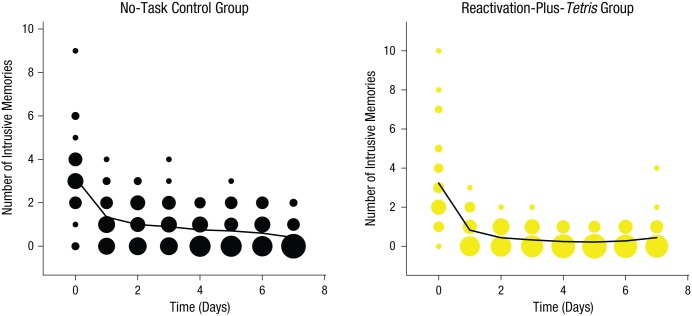
Fig. 2.
Results from Experiment 1: frequency scatter plots showing the time course of the mean number of intrusive memories reported in the diary daily from Day 0 (prior to intervention) to Day 7, separately for the two groups. Note that the intervention was on Day 1. The solid lines are the results of a generalized additive model (see Equation 1). The size of the bubbles represents the number of participants who reported the indicated number of intrusive memories on that particular day.

