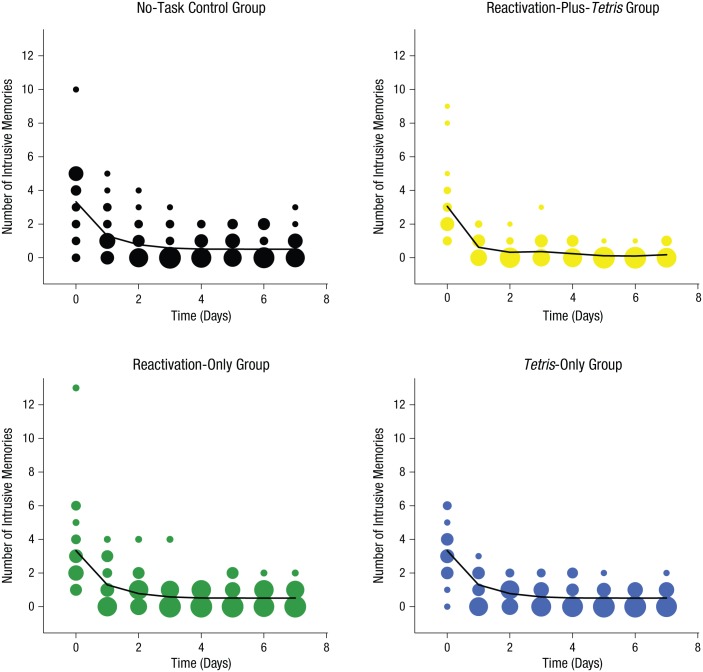
Fig. 5.
Results from Experiment 2: frequency scatter plots showing the time course of the number of intrusive memories reported in the diary daily from Day 0 (prior to intervention) to Day 7, separately for the four groups. Note that the intervention was on Day 1. The solid lines show the results of a generalized additive model in which the three control groups (no-task control, Tetris only, and reactivation only) were fitted with the same line (see Equation 1). The size of the bubbles represents the number of participants who reported the indicated number of intrusive memories on that particular day.

