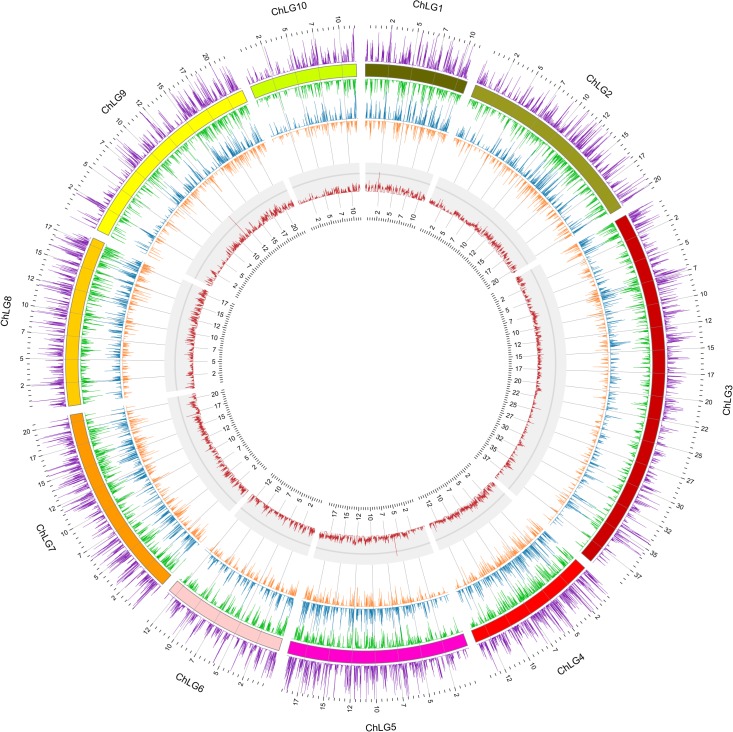
Fig 3. Abundance and distribution of the EAB transcripts compared to T. castaneum genome.
The transcripts with ORFs longer than 300 bp were compared to the T. castaneum genome. A window of 10 kb was adopted to analyze the density distribution of the best hit region. External track shows T. castaneum gene density in both + (outside) and—(inside) strands. The middle track shows the density of the alignments of EAB transcripts to T. castaneum genome, in both + (outside) and—(inside) strands. Inner-most track shows the GC profile of T. castaneum genome.

