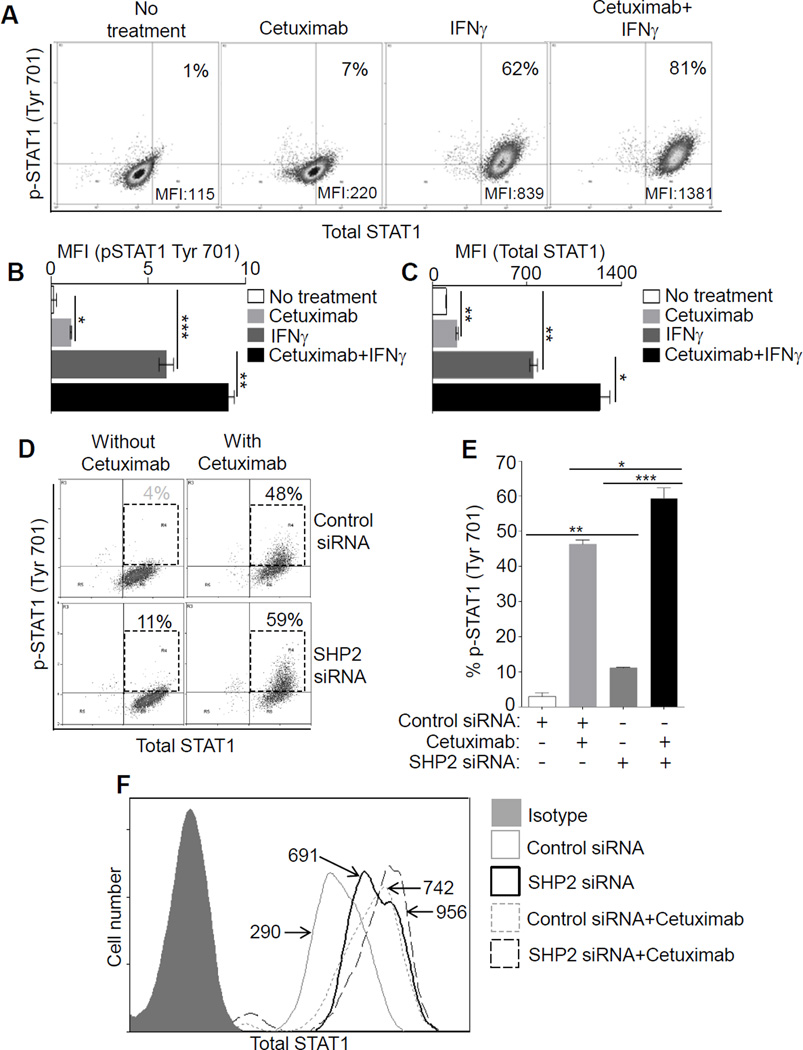
Figure 2. Inhibition of EGFR-SHP2 pathway induces STAT1 activation.
In JHU-029 cells, levels of p-STAT1 (Tyr701), total STAT1 were determined after treatment (48h) with cetuximab (10 µg/ml), IFNγ (10 U/ml), cetuximab plus IFNγ (10 µg/ml, 10U/ml), and a representative dot plot analysis with upper right quadrants indicating % p-STAT1 (Tyr701) cells (y-axis) and MFI values of total STAT1 (x-axis) is shown (A). Statistical analysis for p-STAT1 (Tyr 701) MFI and total STAT-1 MFI are shown (B-C). HNC cells were treated with SHP2 siRNA or control siRNA (24h). Afterward cells were treated with cetuximab (5 µg/ml, 48h) and levels of p-STAT1 (% positive cells, y-axis) and total STAT1 (MFI, x-axis) were determined and a dot plot analysis is shown (D). Numbers in UR quadrants of dot plot analysis for p-STAT1 (Tyr701) is also shown in a separate bar diagram (E). Similarly, levels of total STAT1 in JHU-029 cells were determined with FACS in the experimental conditions indicated in the histogram: isotype Ab (filled gray), control siRNA (gray thin solid line, MFI 290), SHP-2 siRNA (black thick solid line, MFI 691), control siRNA+ cetuximab (gray dotted line, MFI 742), SHP-2 siRNA+ cetuximab (black thin, long dashed line, MFI 956) (F). Results represent mean +/− SEM from three independent experiments. (*P≤0.05, **P≤0.001, ***P≤0.0001)

