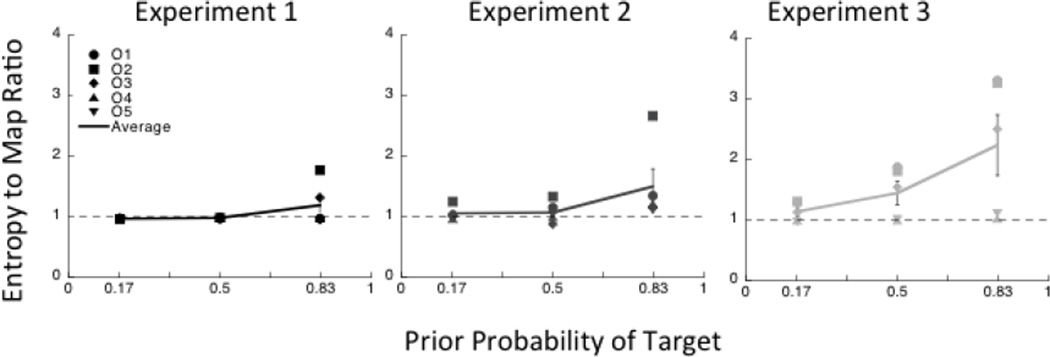
Figure 4.
The ratio of Entropy to MAP saccades is plotted as a function of prior probability for Experiments 1, 2 and 3. The dashed line represents a ratio of 1. Different symbols show data for different observers and the continuous line shows the average with error bars representing the standard error across the 5 observers.

