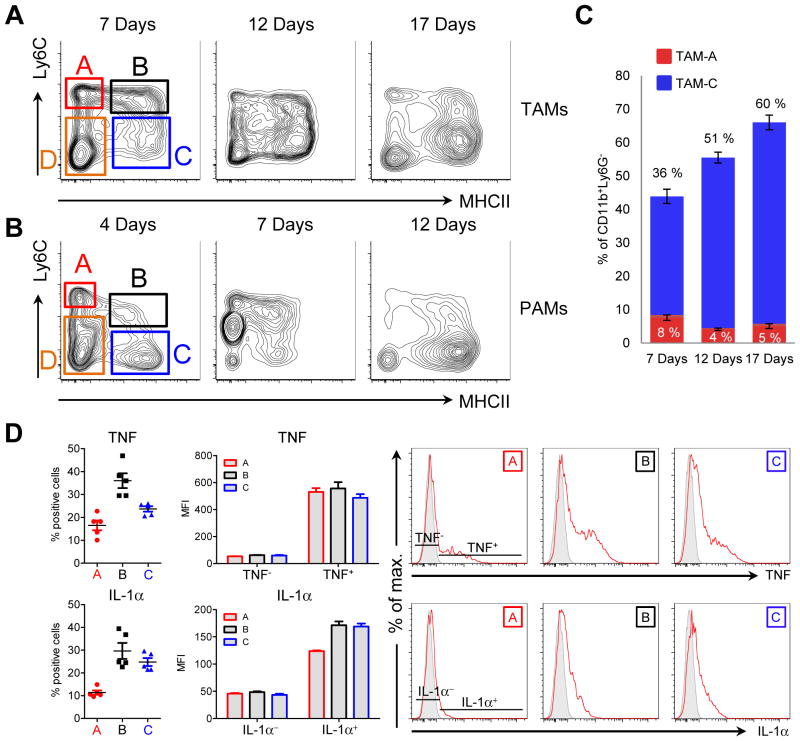
Figure 1. NRI associated macrophages share a common mode of development and express pro-inflammatory cytokines.
A and B, flow cytometry plots of CD11b+Ly6G− myeloid cells isolated from EG7 thymomas (A) or zymosan induced peritonitis (B) at different timepoints as indicated. Plots are representative for at least 2 experiments. Gates A, B, C and D indicate tumor-associated macrophage (TAM) or peritonitis-associated macrophage (PAM) populations used for sorting experiments or to measure cytokine production by intracellular flow cytometry. C, quantitative analysis of EG7 TAM populations A and C (gated as in A) over time. Data are values from 1 out of 2 independent experiments (n ≥ 4). Error bars, SEM. D, quantitative analysis of cytokine production by flow cytometry of EG7 TAM populations A, B and C gated as shown in 1A. Values from individual mice are either depicted as percent positive cells (left panels) or Median Fluorescence Intensity (MFI, middle panel) of TNF or IL-1α positive (TNF+, IL-1α+) compared to negative (TNF−, IL-1α−) macrophages with in population A, B and C. Example plots are shown (right panel) indicating the gating strategy for cells considered positive and negative. Unstained control is shown in grey. Data represent the mean +/− SEM of 2 independent experiments (n ≥ 2).

