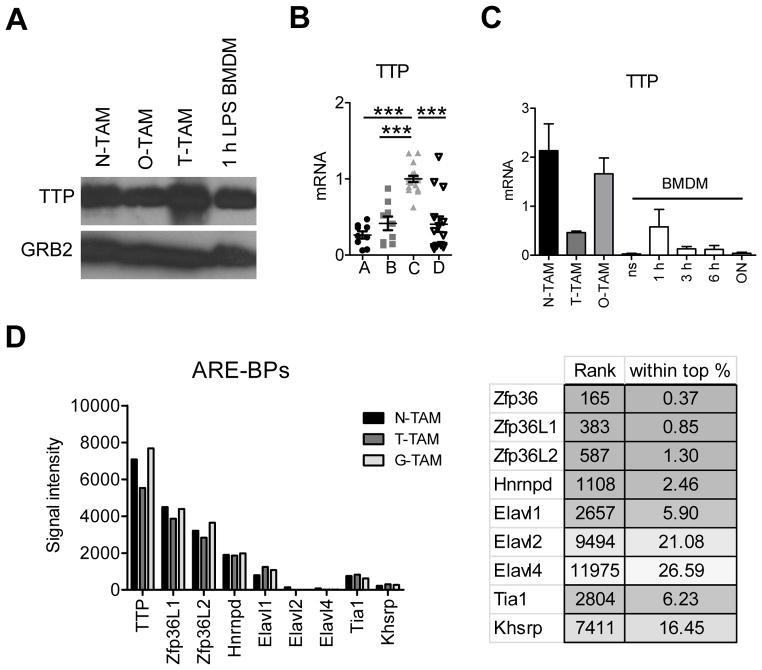
Figure 2. TTP is highly expressed in selected TAM populations.
A, immunoblot analysis of TTP expression in neuroblastoma (N), osteosarcoma (O) and EG7 thymoma (T) TAMs compared to 1 hour LPS stimulated BMDMs. Blot was reprobed with anti-GRB2 to test for equal loading and represents 1 out of 3 experiments. B, TTP qRT-PCR of EG7 TAMs sorted for the indicated populations as in Figure 1A. Data from individual mice are expression values from 4 experiments (n ≥ 6). All values were first normalized to the corresponding GAPDH and then to the mean of TAM-C within each experiment. Data were analyzed by One-way Anova followed by Bonferroni Post Test. The mean per group is shown as black line. Error bars, SEM. C, qRT-PCR analysis of TTP in TAMs or BMDMs left untreated (ns) or stimulated with LPS + IFNγ over time. Data were normalized to the corresponding GAPDH for each value and represent the mean +/− SEM (n ≥ 3). D, microarray analysis of TAMs isolated from Neuroblastomas (N-TAM), EG7 Thymomas (T-TAM) and Gliomas (G-TAM) showing average signal intensities of selected AU-rich element binding proteins (ARE-BPs, n = 3 per TAM type). The right panel shows the rank of different ARE-BPs in N-TAMs together with the rank as percentage among all 45038 probe sets, respectively. The full microarray dataset has been submitted (GEO accession number GSE59047).

