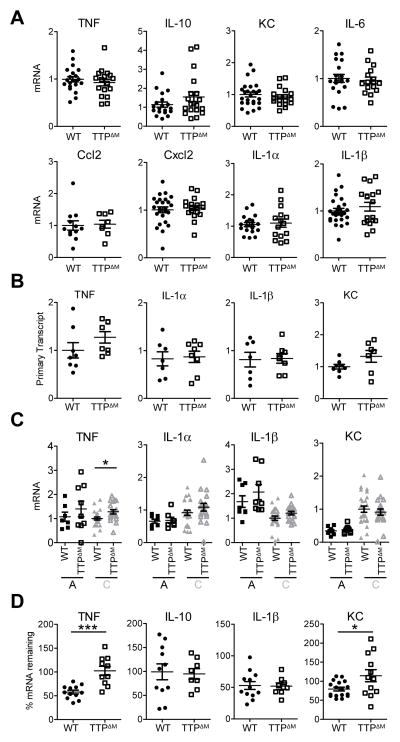
Figure 4. TTP-dependent mRNA decay is limited in TAMs.
A, qRT-PCR analysis of EG7 TAMs isolated from WT and TTPΔM mice. Data from at least 3 experiments were combined and values from individual mice (n ≥ 8) were normalized to the corresponding GAPDH followed by the mean WT within each experiment. The mean per group is shown as black line. Error bars, SEM. B, qRT-PCR analysis of primary transcripts of inflammatory mRNAs in WT and TTPΔM TAMs. Values from individual mice (n ≥ 7) were normalized to GAPDH and mean WT within each experiment and are combined from 2 experiments. Identical samples from each tumor were processed in the absence of reverse transcriptase to serve as controls for genomic DNA contamination. The mean per group is shown as black line. Error bars, SEM. C, qRT-PCR analysis of TTP target mRNAs in EG7 TAM population A and C isolated from WT and TTPΔM mice. Data represent the expression values of individual mice (n ≥ 7) combined from 2–4 experiments. Values were normalized to the corresponding GAPDH and subsequently to the mean of WT TAM-C within each experiment. Mean is shown as black line. Error bars, SEM. D, mRNA stability measured by qRT-PCR by comparing cells before and 90 minutes after transcriptional blockade by Actinomycin D in EG7 TAMs from WT and TTPΔM mice. Values were normalized to GAPDH and represent % cytokine mRNA remaining after Actinomycin D treatment as mean and SEM. Data are expression values from individual mice combined from 2–3 experiments (n ≥ 8). Mean is indicated by a black line. Error bars, SEM.

