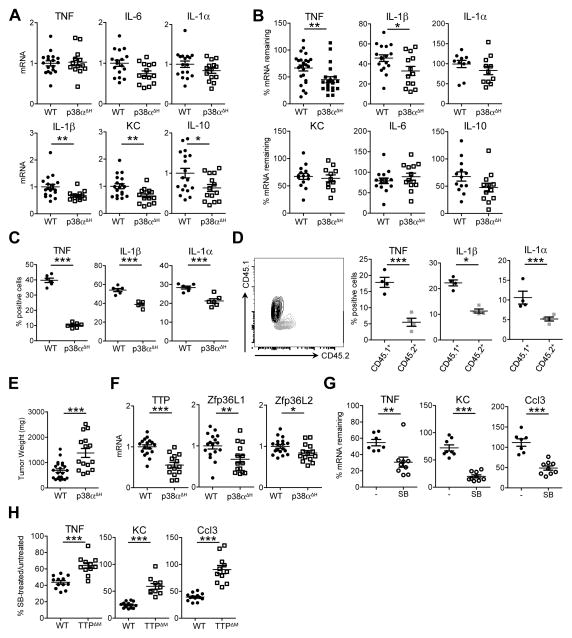
Figure 6. p38α regulates TTP expression and activity in TAMs.
A, EG7 TAM RNA from WT or p38αΔH tumor bearing mice was analyzed by qRT-PCR. Expression values from individual mice combined from 3 experiments (n ≥ 13) were normalized to GAPDH and the mean WT within each experiment and are depicted as mean indicated by black lines. Error bars, SEM.
B and G, mRNA stability measured by qRT-PCR as in Figure 4Din EG7 TAMs from WT (Mapk14flox/flox) and p38αΔH animals (B) and in unstimulated (−) or SB203580 (SB) treated WT EG7 TAMs (G). SB treatment was started concomitant to Actinomycin D imposed transcriptional blockade. Data represent values from individual mice normalized to GAPDH from either 3–5 (n ≥ 10, B) or 1 out of 2 (n ≥ 7, G) experiments, respectively. Black lines indicate the mean per group. Error bars, SEM. C, cytokine expression analyzed by flow cytometry of EG7 TAMs (gated on CD11b+) isolated from WT or p38αΔH mice. Values from individual mice are percent of CD11b+ cells (n = 6) representing 1 out of 2 experiments with the mean depicted as black line. Error bars, SEM. D, cytokine production evaluated by intracellular flow cytometry in lethally irradiated mice reconstituted with a mixture of WT (CD45.1) and p38αΔH (CD45.2) bone marrow (n = 4). Depicted values represent % positive cells of CD11b+ TAMs gated for CD45.1 or CD45.2 as shown (left panel). Error bars, SEM. E, EG7 tumor mass 12days post transplantation of EG7 cells into WT or p38αΔH animals. Values from individual mice combined from 3 experiments are shown with the black line representing the mean. Error bars, SEM. F, qRT-PCR analysis of TTP and TTP family members in EG7 TAMs from WT and p38αΔH mice. Data represent expression values from individual mice (n ≥ 14) normalized to GAPDH and the corresponding mean WT from 3 independent experiments. The mean is shown as black line. Error bars, SEM. H, mRNA decay measured in WT and TTPΔM EG7 TAMs with and without SB treatment as in G. Values of individual mice are depicted as % of mRNA stability after SB treatment relative to the corresponding stability in untreated WT or TTPΔM TAMs. Values were normalized to GAPDH and the corresponding untreated TAM sample (n ≥ 9) and were combined from 2 experiments. The black line represents the mean. Error bars, SEM.

