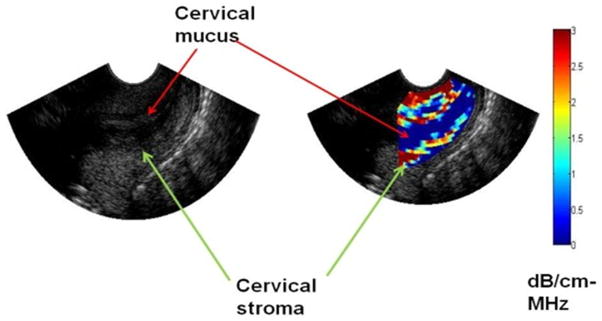
Figure 2. Scan of the cervix displaying tissue architecture via attenuation mapping.

The colored pixels represent attenuation values the stroma of the cervix and the blue pixels in the cervical canal (mucus which is almost totally water) have an attenuation value close to 0, consistent with the attenuation of water.
