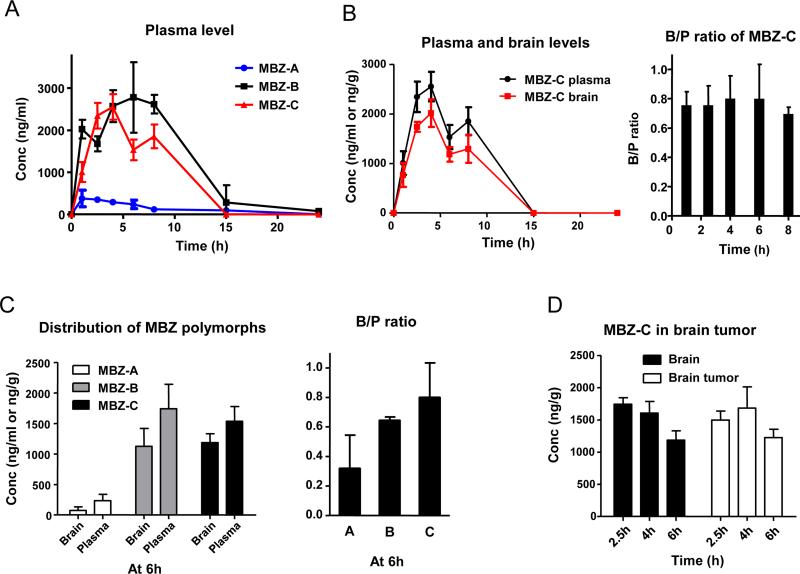
Figure 2. Plasma and brain distributions of MBZ polymorphs.
A. A time course of the MBZ plasma levels in C57BL6 mice after oral gavage of MBZ-A, B or C at 50mg/kg.
B. (Left panel) Brain and plasma levels of MBZ-C in a time course after oral gavage at 50mg/kg. Animals were thoroughly perfused with PBS for all brain distribution studies. (Right panel) Brain/plasma (B/P) ratios of MBZ-C. Data were collected from three mice at each time point.
C. (Left panel) Brain and plasma levels of MBZ polymorphs at 6 h following oral gavage (50mg/kg). B/P ratio of MBZ polymorphs at 6 h following oral gavage. (Right panel) The mean B/P ratio of MBZ-A is 0.32, MBZ-B is 0.64 and MBZ-C is 0.80.
D. MBZ-C distributed equally in the brain and brain tumor. GL261 tumors implanted in the right side of mouse frontal lobe were resected and compared with the contralateral normal brain tissue.

