Figure 2.
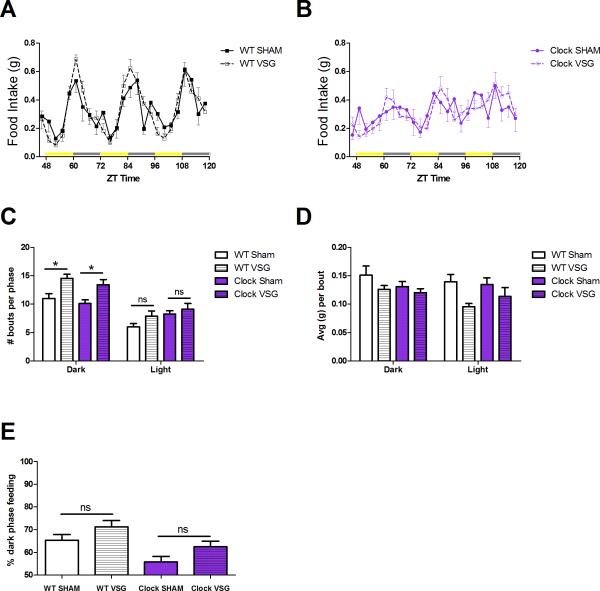
24-h feeding patterns. Feeding patterns of WT (A) and Clock (B) mice with Sham (solid lines) and VSG (dotted lines) are plotted in 3-h increment over the course of 3 d. ZT time denotes hours after lights on. Yellow bars on the x-axis represent lights on, grey bars represent lights off periods. (C) Total number of meal bouts per phase, grouped by bouts during the 12-h dark and 12-h light period. (D) The average amount of food consumed (g) per bout in the 12-h dark and 12-h light phase. (E) Percentage of dark phase feeding as measured by the total calories consumed during the 12-h dark divided by the total calories consumed during the 24-h period. No significant differences are denoted by “ns”. Data expressed as mean ± SEM, *P < .05.

